Excellent Accuracy, Resolution, and Repeatability
Predictive Maintenance Management requires that the UT thickness source data has excellent accuracy, resolution, and repeatability.
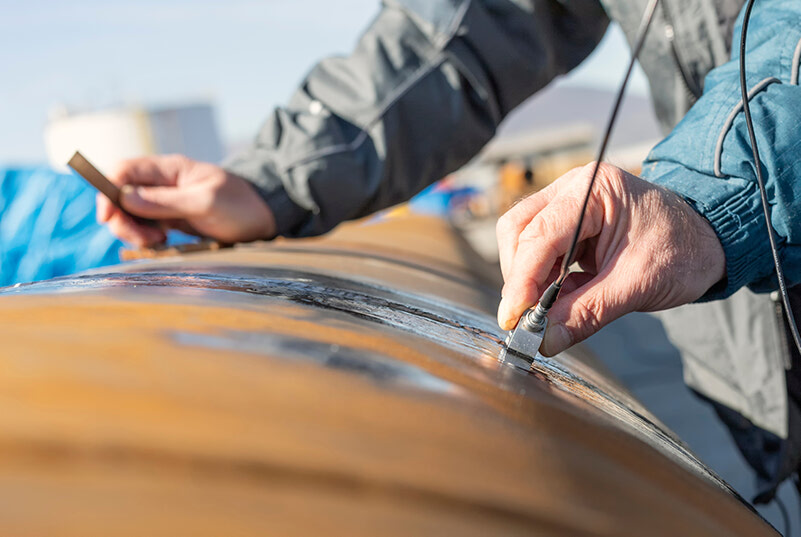
Factors that affect the variability of the manual readings are:
- Sensor location variability
- the painted spots are about 5cm diameter and the sensor face is about 1cm
- there is often little room for access in the 6:00 position because of silting, water, snow or ice so finding the spots is difficult to impossible.
- Surface cleanliness
- Silting, water, snow, ice would need to be cleaned away
- Couplant application
- Need all temperature couplant gel
- Calibration of the instrument and probe
- Ambient temperature compared to the operating temperature of the pipe can be up to 80 deg C.
- Setup of the instrument detection method and gates
- For speed of taking a survey where the pipe wall thickness could change from 18mm to 4mm requires a wide gate range
- Operator not able to verify that the present reading is reasonable with respect to previous readings
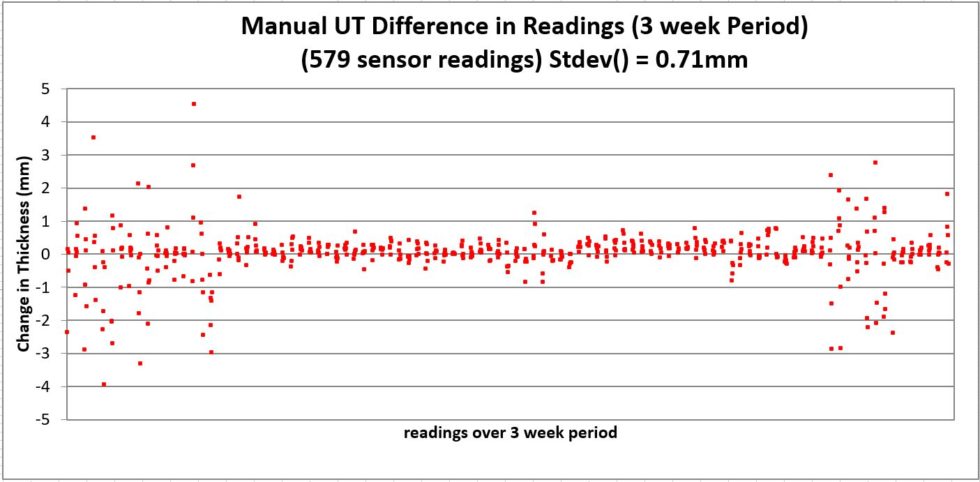
A sample of Manual-UT data was checked in positions where no erosion or corrosion wear is expected – between the 10:30 position and the 1:30 position.
- The Manual-UT survey was taken on a 3 week interval.
- There was 579 readings evaluated after rejecting readings from spools that were replaced or rotated in the interval.
- The average error was 0.04mm which means that the deviations in thickness appear like noise.
- The stdev() was 0.71mm so for 95% confidence that you have the right value you would need to accept errors of +/-1.42mm. This much variation makes it impossible to determine a reliable wear rate over the 3 week period using automatic analysis – you would need to rely on the eye of the analyst to take a guess.

The key feature of the PIP360 measurements is that the sensors are permanently bonded to the pipe surface. The measurements are taken from exactly the same location and the couplant does not change.
The PIP360 sensor installation overcomes issues related to the sensor location variability, surface cleanliness, and couplant application.
The PIP360 instrument data collection, data validation, and thickness detection algorithms are automatically adjusted for each sensor. The analysis with respect to previous readings and recent historical metal loss rate on the sensor and its adjacent sensors proves that the data is very reliable.
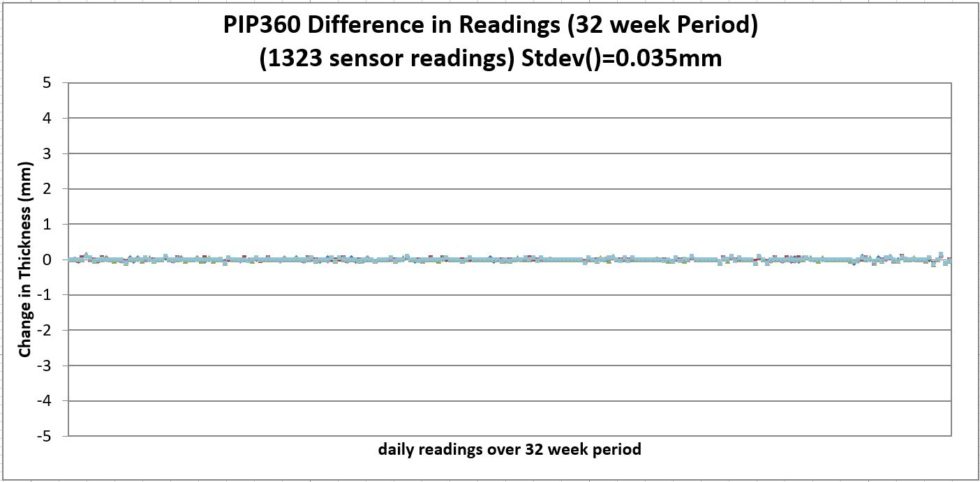
A sample of PIP360 Auto-UT readings on the same train was checked over a longer period of time (to include seasonal changes) – between the 10:30 position and the 1:30 position.
- The Auto-UT survey includes data over a 32 week interval.
- There was 1323 readings evaluated after rejecting readings from spools that were replaced or rotated in the interval.
- The average error was -0.0002mm which means that the deviations in thickness were very small.
- The stdev() was 0.035mm so for 95% confidence that you have the right value you would need to accept errors of +/-0.07mm which is 20 times better than typical Manual-UT data.
- With readings this stable, it is easy to obtain a reliable wear profile in as little as 14 running days.
- Daily thickness changes are easy to see in areas where metal loss is occurring.
- Changes in metal loss rate are easy to see every day and could be correlated to operating system changes.

|


